 Crown Copyright © Ordnance Survey |
 Crown Copyright © Ordnance Survey |
 Crown Copyright © Ordnance Survey |
Crown Copyright © Ordnance Survey |
Crown Copyright © Ordnance Survey |
 © Copyright Bartholomew |
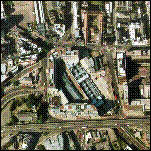 © Copyright Cities Revealed |
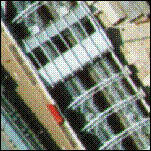 © Copyright Cities Revealed |
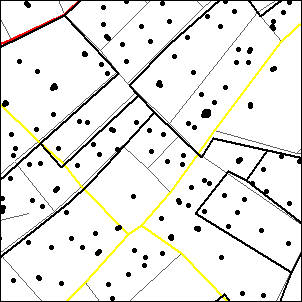 Crown Copyright © Ordnance Survey |
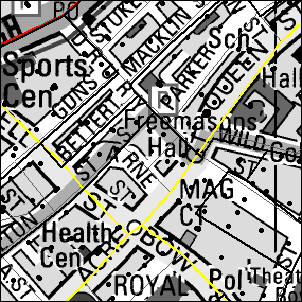 Crown Copyright © Ordnance Survey © Copyright Bartholomew |
 LIFESectors © Copyright Business Geographics |
 LIFESectors © Copyright Business Geographics |