LIFESectors are the result of joint research and development between Experian, one of the UK's largest collectors of lifestyle data, and Business Geographics.
Using Experian's database of around 15 million responses to questionnaires issued by the Consumer Research Bureau, Business Geographics have aggregated the responses to postcode sector level, using market research-style weighting techniques to remove demographic biases.
Weighting has been applied to ensure that the lifestyle estimates at the local level reflect the behaviour of local populations.
Some LIFESectors questions relate to the household (such as housing tenure and family income) and others relate to individuals (such as newspaper readership and financial activity). 'Individual' questions also invite partner/spouse responses. The two types of question have been treated separately in the weighting exercise and, in view of the spouse responses, have different bases.
The first version of LIFESectors, released in May 1998, was generated using questionnaire responses from 1996, 1997 and 1998. The total number of questionnaires used was around 5 million, leading to around 8 million responses for the 'individual' questions.
The volume of data available enabled the creation of postcode sector level estimates that are based on several hundred responses. The resulting product is a set of 480 percentage estimates of lifestyle characteristics. The product also contains household and adult population estimates for each postcode sector, to enable results to be computed for groups of sectors or catchment areas.
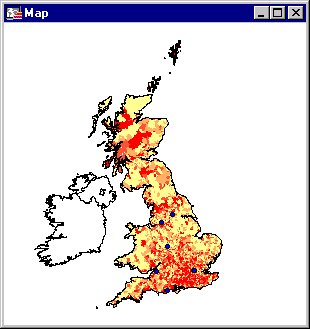
For postcode sectors that have yielded insufficient responses (less than 150 questionnaires), data has been imputed from neighbouring sectors. These sectors account for about 15% of the total but only 6% of the population. The main problem areas are the inner cities, particularly Liverpool (L) and London (EC, WC, W1). In fact sectors in EC and WC had to be combined to generate a single set of estimates for each postcode area.
The second release of LIFESectors, due in Quarter 3 1999, will incorporate responses from more recent questionnaires. The expected questionnaire base for the second release is around 9 million, with information on around 14 million individuals.
LIFESectors data packs
LIFESectors data are organised into several base topics and topic packs:
LIFESectors base topics and topic packs are supplied at postcode sector level for the whole of Great Britain.
Postcode sector level packs may also be supplied for:
Postcode areas
Government standard regions
Counties
Television areas
If you require a quote for the supply of a geographical subset of LIFESectors data please either contact the office or send email to info@geoweb.co.uk.
The following specification details the methodology and sample sizes for the first release of LIFESectors. The second release is being generated using the same methodology, but with a higher sample base.
Question definitions
The 480 lifestyle questions for which postcode sector level estimates have been generated are each of one of two types; household-based or individual-based.
The household-based questions are those questions to which the respondent was asked to provide information relating to the household rather than to themselves. These include questions relating to household income, household appliances, and housing tenure.
The individual-based questions are those that relate to personal behaviour and preferences. Estimates for most of these questions include information relating to the spouse of the respondent and, consequently, the sample bases are higher. These questions include newspaper readership, financial activity, and holiday preferences.
Weighting
The lifestyle questionnaire responses form a self-selecting sample. Although the questionnaires were sent to almost every household in the country, the response was optional. The sample in its raw form is not, therefore, representative of the households and population of Great Britain.
The MOSAIC profile of the whole database is, however, encouragingly close to the profile of Great Britain, implying that in terms of geo-demographics the sample is fairly representative at the national level.
In terms of personal demographics such as age, sex, and marital status the sample exhibits significant skewness - around 70% of the questionnaires were completed by women, and the 18-24 year old age group is under-represented.
The gender bias has not proved to be a large problem. When the spouse responses were taken into account the national base for the individual-based questions was almost 50% male. In addition, gender was not taken into account for the household-based questions, as the respondent was deemed to be representing the household.
Weighting was, however, required at the local level and postcode district-level Census data was used to remove the inherent biases in the responses. The choice of demographic variables to use in the weighting was limited to those variables which appeared both on the questionnaires and the 1991 Census.
Responses used in the generation of postcode-sector level estimates of the questions were weighted at postcode district-level. Responses for the household-based questions were weighted by age of head of household and marital status of respondent. Responses for the individual-based questions were weighted by age, gender, and marital status.
The effective sample size was calculated for each postcode sector, and each type of question,. In each case, this statistic is less than the actual sample size, and varies with the level of weighting required. In situations where the demographic profile of the questionnaire responses varied greatly from the Census demographics, and larger weights were therefore required, the effective sample size is smaller.
Merging of postcode sectors
Some postcode sectors have insufficient residential population to yield a set of lifestyle estimates. In these cases, no estimates have been derived.
In other cases, the population and household counts are sufficiently large, but the number of lifestyle responses is not. In these cases, data had to be imputed from a neighbouring sector or sectors in order to generate meaningful estimates. All sectors for which the effective sample size for the household-based questions was less than 150 were considered to have insufficient data.
In view of the local nature of some of the questions - such as 'Which shops do you frequent?' - it was necessary to use data from a neighbouring sector, rather than from a distant sector with similar demographic composition.
Each sector in Great Britain had already been classified into one of ten demographic groups using cluster analysis. In cases where a sector had insufficient responses, data was imputed from a sector that was both geographically adjacent and from the same demographic cluster.
In some case, such as in inner cities, estimates were derived for a whole postcode district - or even a whole postcode area in the cases of EC and WC. These estimates were then attributed to each postcode sector in the district (or area).
Postcode sectors for which estimates were derived using imputed data represent around 15% of the total, and contain around 6% of the population.