The sample is to be representative, both demographically and geographically, of the adult population of the county.
Business Geographics recommend an Enumeration District based, stratified random location quota sample.
Sample Design
Number of sampling points
The number of sampling points used will affect the level of clustering and therefore the statistical confidence interval associated with the survey results. A smaller number of sampling points will mean a higher level of clustering, which will result in a wider confidence interval. The impact of this clustering, known as the design effect, will also depend on the level of variation of responses between clusters. If the survey is measuring attributes that are likely to vary considerably between regions and/or demographic groups, then the clustering effect will be greater.
After consultation with the client and the client's field department, a decision is reached to use 100 Enumeration District (ED) sampling points. 10 respondents will be drawn from each sampling point.
Stratification
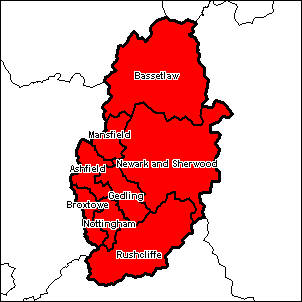
Business Geographics recommend that the sample be stratified by Local Authority (LA). There are eight LAs in the county of Nottinghamshire. The number of sampling points drawn from each Local Authority is constrained to match - subject to rounding errors - the proportion of the county's total population contained within each Authority.
The adult population of Nottinghamshire is split across each of the Local Authorities in the following proportions:
Local Authority
% Total Population
Number of Sampling Points
Ashfield
10.9
11
Bassetlaw
10.6
11
Broxtowe
10.8
11
Gedling
11.1
11
Mansfield
10.1
10
Newark/Sherwood
10.3
10
Nottingham
26.4
26
Rushcliffe
9.8
10
Within each Local Authority the sampling points are sorted by MOSAIC, a geodemographic discriminator. This introduces a second level of stratification.
Using a fixed interval counter of 18+ population and a random start point, the appropriate number of Enumeration Districts are sampled from each LA. The probability of an ED being sampled is proportional to the 18+ population of the ED. This ensures that adults throughout the county have the same overall probability of being selected for interview.
Quotas
10 interviews will be taken at each sampling point. The respondents used at each sampling point should be as representative as possible of the adult population in that sampling point.
Business Geographics have access to the 1991 Census Small Area Statistics, detailing the composition of the UK population at the lowest level of aggregation, the Enumeration District (typically containing around 150 households). The demographic profile of each sampling point can be used to set interview quotas - controls - for key demographic variables such as age, sex and working status.
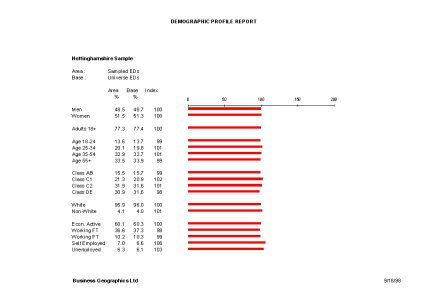
For example, an interviewer may be given the following quota to achieve:
Interlocking quotas are also available (eg 3 men aged 18-24) together with further demographic counts - such as dwelling type, tenure, limiting long-term illness and so on - where these are perceived to have relevance to the outcome of the survey.
This A4 format has been designed to give field operators sufficient room to annotate response codes beside the quotas on the sheets. Individual premises are listed separately on the sheets and a space has been provided between each to allow for interviewers' markings.
Whilst this format has been designed with field operators in mind, Business Geographics recognises that different field departments have different sets of preferences. We are happy to work with clients to design output formats that meet their individual requirements.
Supplementary Information
In addition to the service and outputs described above Business Geographics provides a set of descriptive tables and a map that gives the client a clear picture of the study area and of the sample that has been drawn from that universe.
The supplementary information comprises:
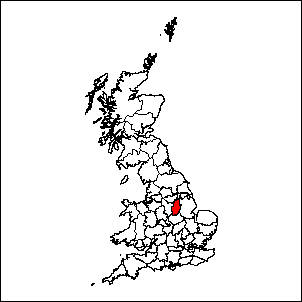
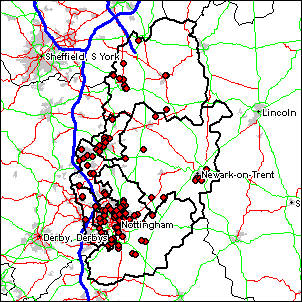
A map of the study area. This map will show the boundaries of any geographic areas areas used in the stratification as well as other boundaries requested by the client. The map will also show towns, roads and other features. Most importantly, the locations of the sampling points will be superimposed on the map.
A table showing the total quota percentages for the sample, the relevant demographic percentages for the study area and for Great Britain.
These additional items add significantly to the value of a sample from Business Geographics by demonstrating that the sample is representative both in terms of geography and demography.
Pricing
The cost of a sample depends upon the complexity of the sample design and the number of points sampled.
If you require additional information - or would like to discuss a sampling project - please either contact the office or send email to Mark Watson.